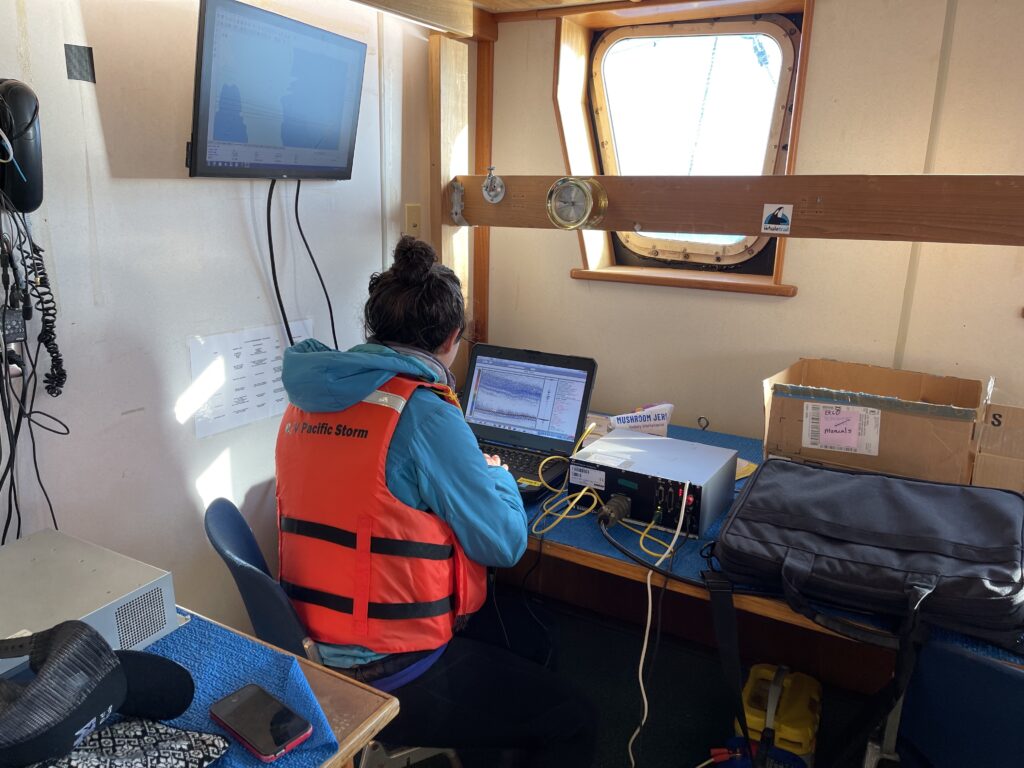
We use a Simrad EK60 120 kHz split-beam echosounder to map the prey distributions and densities during each HALO survey aboard the R/V. Pacific Storm. The echosounder has been kindly loaned to the project by the WHET Lab. So, while we use passive acoustics to listen to whales, we use active acoustics to see their prey.

The 120 kHz frequency is optimal for targeting euphausiids, or krill, the dominant prey group of many whale species off the Oregon Coast. Krill tend to form dense aggregations that we can identify from active acoustic data.
Since krill occur in these aggregations, they are an excellent prey source for whales. Once we have identified krill aggregations, we can determine their exact locations in three-dimensional space (latitude, longitude, and depth within the water column). Each aggregation will come with a corresponding timestamp. We can then use these time-space stamps to match whale presence with prey presence.

Beyond that, the active acoustics can also tell us what depth the prey are at and even the shape and density of their aggregations. From there, we can start to identify the types of prey aggregation formations that different whale species target.