Visual Survey Methods
We conduct visual surveys for cetaceans using standardized distance sampling methodology, which is a common approach to estimate cetacean distribution and density. Distance sampling relies on the assumption that while surveying a trackline for animals, a proportion of the animals present in the area is not detected, and this proportion increases with increasing distance from the trackline. The probability of detecting an animal in the vicinity of the trackline is modeled as a detection function, which may vary with weather (e.g., bad visibility impairs detection) and with species (e.g., the surface behavior or blow height of some whale species may be more detectable at a distance, whereas long dive times of some species may lead to a greater chance of missing them).

To collect data in this distance sampling framework, we do a few essential things while on the vessel and on survey:
- We always monitor and record the survey conditions (i.e., wind speed, swell height, rain, fog) as these environmental factors affect our ability to detect cetaceans.
- We constantly record our trackline using a GPS, travel at a standard speed, and have two observers surveying with binoculars and naked-eye for cetaceans from a known height above the water (e.g., from the crow’s nest). This consistency allows us to record and compare “absence data”, which is just as important as presence data because it tells us where the animals are not.
- When we make a cetacean sighting, the most important data to collect right away is the distance and bearing to the sighting. This information allows us to calculate the location of the animal, based on the position of the research vessel and the height of the observer above the water. These data are essential for building the detection functions per species and per survey conditions.
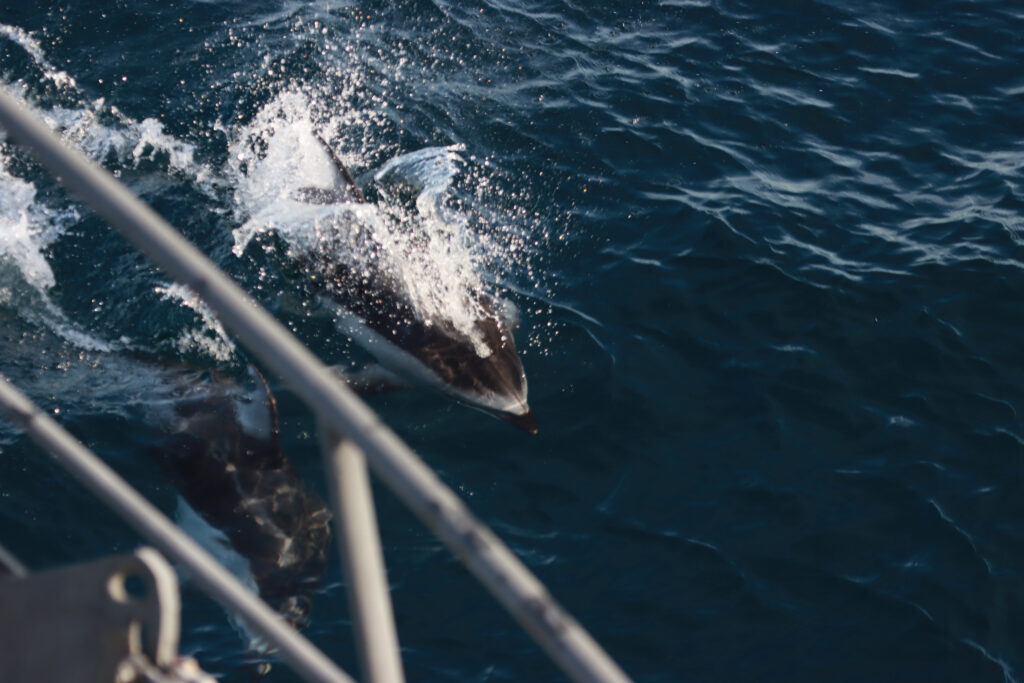
- We attempt to identify the cetacean species to the lowest taxonomic level possible, and record this information, group size, and behavior if possible. We also take photos to help with identification efforts.

Our gear list:
- iPad tablet with the program SeaScribe loaded. SeaScribe is the survey data collection software we use.
- Binoculars
- Handheld GPS (with backup batteries)
- Cameras with long lens (100-400 mm)
- Notebook and pencil
- Sunglasses, warm cloths, sunscreen, hat, gloves
- And chocolate!!!